

When someone asks an AI model about your category, it doesn’t just recommend brands, it also describes them. AI might say things like “great for design teams” or “strong on security, but weaker on integrations.” For many users, that description becomes their first impression, and they rarely see the sources behind it.
Peec AI breaks that description into three tabs, each answering a different question:
- Market: This page, asks what AI associates with your brand and how that stands against your competitors.
- Objections: Asks what AI argues against you when a buyer is deciding.
- Fact-checking: Asks whether what AI says about you is true, measured against facts you state yourself.
All three run on Perception’s own set of AI answers rather than your tracked prompts, and all three follow the model filter at the top of the page. Brand Insights is separate: it zooms into a single brand and shows how it performs across models, topics, geographies, and competitors.
Attributes
Peec AI breaks AI’s view of your brand into attributes, the qualities models associate with brands in your industry (for example reliability, performance, value for money, or ease of implementation). Attributes aren’t a fixed checklist. Peec extracts them from real AI answers and clusters similar ones together, so the set reflects how your space is actually described. For every attribute you can see how strongly it’s associated with your brand and how that compares with your tracked competitors. Peec asks AI two different questions, and the page keeps them apart because they answer different things:- Asked about your brand: “What is this brand known for?” The answer gives each attribute an association score from 0 to 100, where 100 means the attribute always comes up first when AI describes you.
- Asked about your industry: “Which brands are known for this attribute?” The answer gives every brand a market prominence score from 0 to 100, where 100 means the brand is always named first, and 0 when it is never named.
Summary
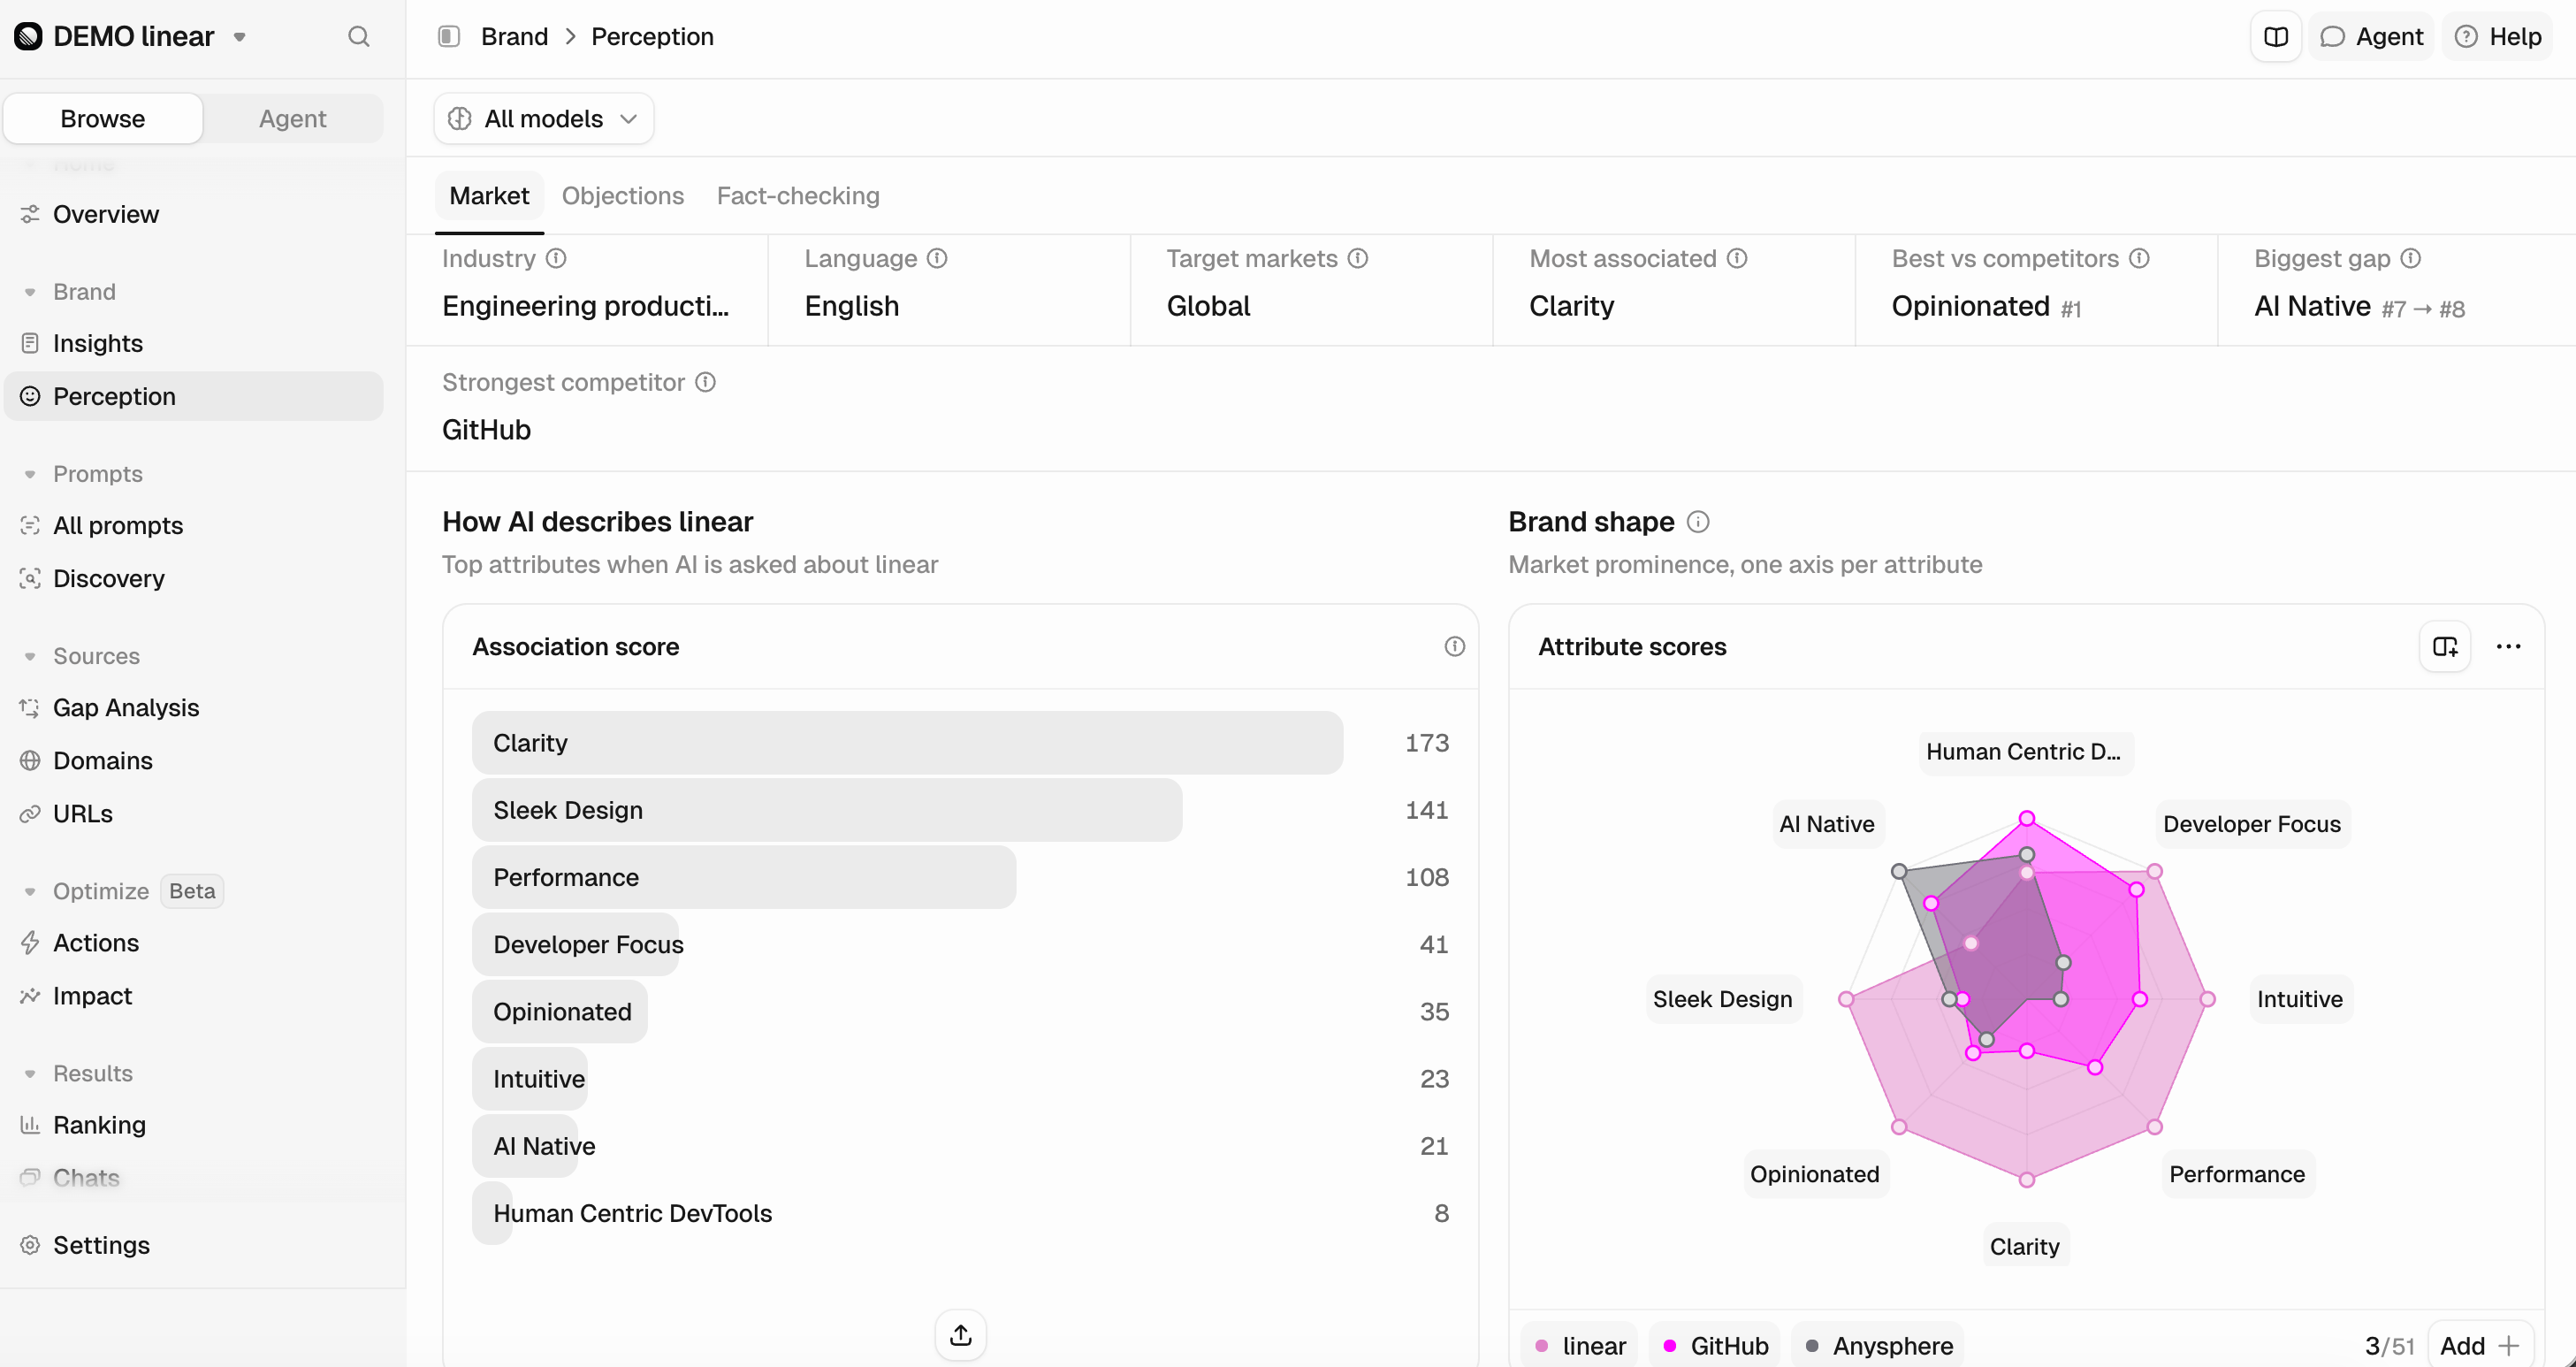
The page is organized into four sections, moving from a high-level overview to detailed insights. Starting with a headline that states the finding in a sentence, for example “AI describes Expedia as Affordability, but it competes best on Adventure Travel”. Above it, a timestamp shows how long ago the last run finished; hover it for the estimated next run. Below that you will see:- Industry: The industry your competitors are drawn from. Keep it specific, because it decides which brands you are measured against.
- Most associated: The attribute AI reaches for most when asked about your brand. This is the top bar in the chart below it.
- Best vs competitors: The attribute where you come closest to the brand leading it, with your position next to it. Position alone isn’t the ranking criterion, because attributes attract different numbers of brands, so a
#3 of 12and a#3 of 60aren’t the same achievement. Hover for how many attributes you place top three on. - Biggest gap: The attribute AI leans on harder than your market position supports: high when AI is asked about you, low when it is asked about your industry. Shown as two positions, for example
#1 → #9."Unplaced"means you never surface for it in the market at all, which is the widest version of this gap. It needs at least four attributes carrying both scores. - Strongest competitor: The competitor with the highest average market prominence across all attributes.
Your selected industry determines which competitors are included in the analysis.Updating the industry in your project profile does not automatically rerun the analysis. Hover over the timestamp at the top of the page to see when the next analysis is scheduled to run.
Editing your industry for the first time is free, after that you can change it up to three times only, because each change reruns the full analysis.
Editing your industry for the first time is free, after that you can change it up to three times only, because each change reruns the full analysis.
- Brand shape graph: A radar chart that lets you compare your brand perception against your competitors. Each axis represents an attribute your brand is measured and compared on. You can display up to three brands at once and select which attributes to compare against.
- How AI describes your brand: An attribute mention chart that shows the attributes most associated with your brand, sorted by frequency. If the messaging you’re investing in doesn’t show up here, AI hasn’t picked it up yet, and the chats AI cites are where to start looking. These scores answer the “asked about your brand” question, so they don’t line up with the breakdown below. An attribute can top this chart and still sit near the bottom of the market.
- Brand comparison by attribute: A heat map showing how strongly each brand is associated with different attributes, based on the “asked about your industry” question. Each cell contains a score from 0 to 100, making it easy to compare brands and see who leads for each attribute. Brands mentioned more consistently score higher than those that appear only occasionally.
- Attributes and sources: See every tracked attribute, your ranking for each one, and the sources influencing that position.
- Ranking: Your position compared to other tracked brands for the attribute, based on market prominence. Brands with the same score share the same rank, while a dash means your brand never appeared for that attribute.
- Sources: Expand an attribute to see the pages AI used when describing brands for that quality, with links to the full source details.
- For each source, you’ll also see:
- Occurrences: How often AI cited the source across all Brand Perception checks.
- Retrievals: How many tracked chats retrieved the source during the selected date range.
- Citation rate: The average number of citations per retrieved chat.
- URL type and Domain type: How the source page and its domain are classified.
Best practices
- Start with the biggest gap: It names the attribute AI credits you with more than the market does, which is usually more actionable than confirming a strength you already expected.
- Then read what you’re not known for: An attribute where you place well in the market but AI rarely mentions when asked about you is demand you have already earned and aren’t collecting.
- Check individual models: A brand can be perceived very differently in ChatGPT than in Gemini, so aggregated results can hide important differences. Use the model filter for the engines that matter most in your industry.
- Follow attributes to their sources: Use Attributes and sources to turn a low score into the specific pages worth influencing.