Product Table
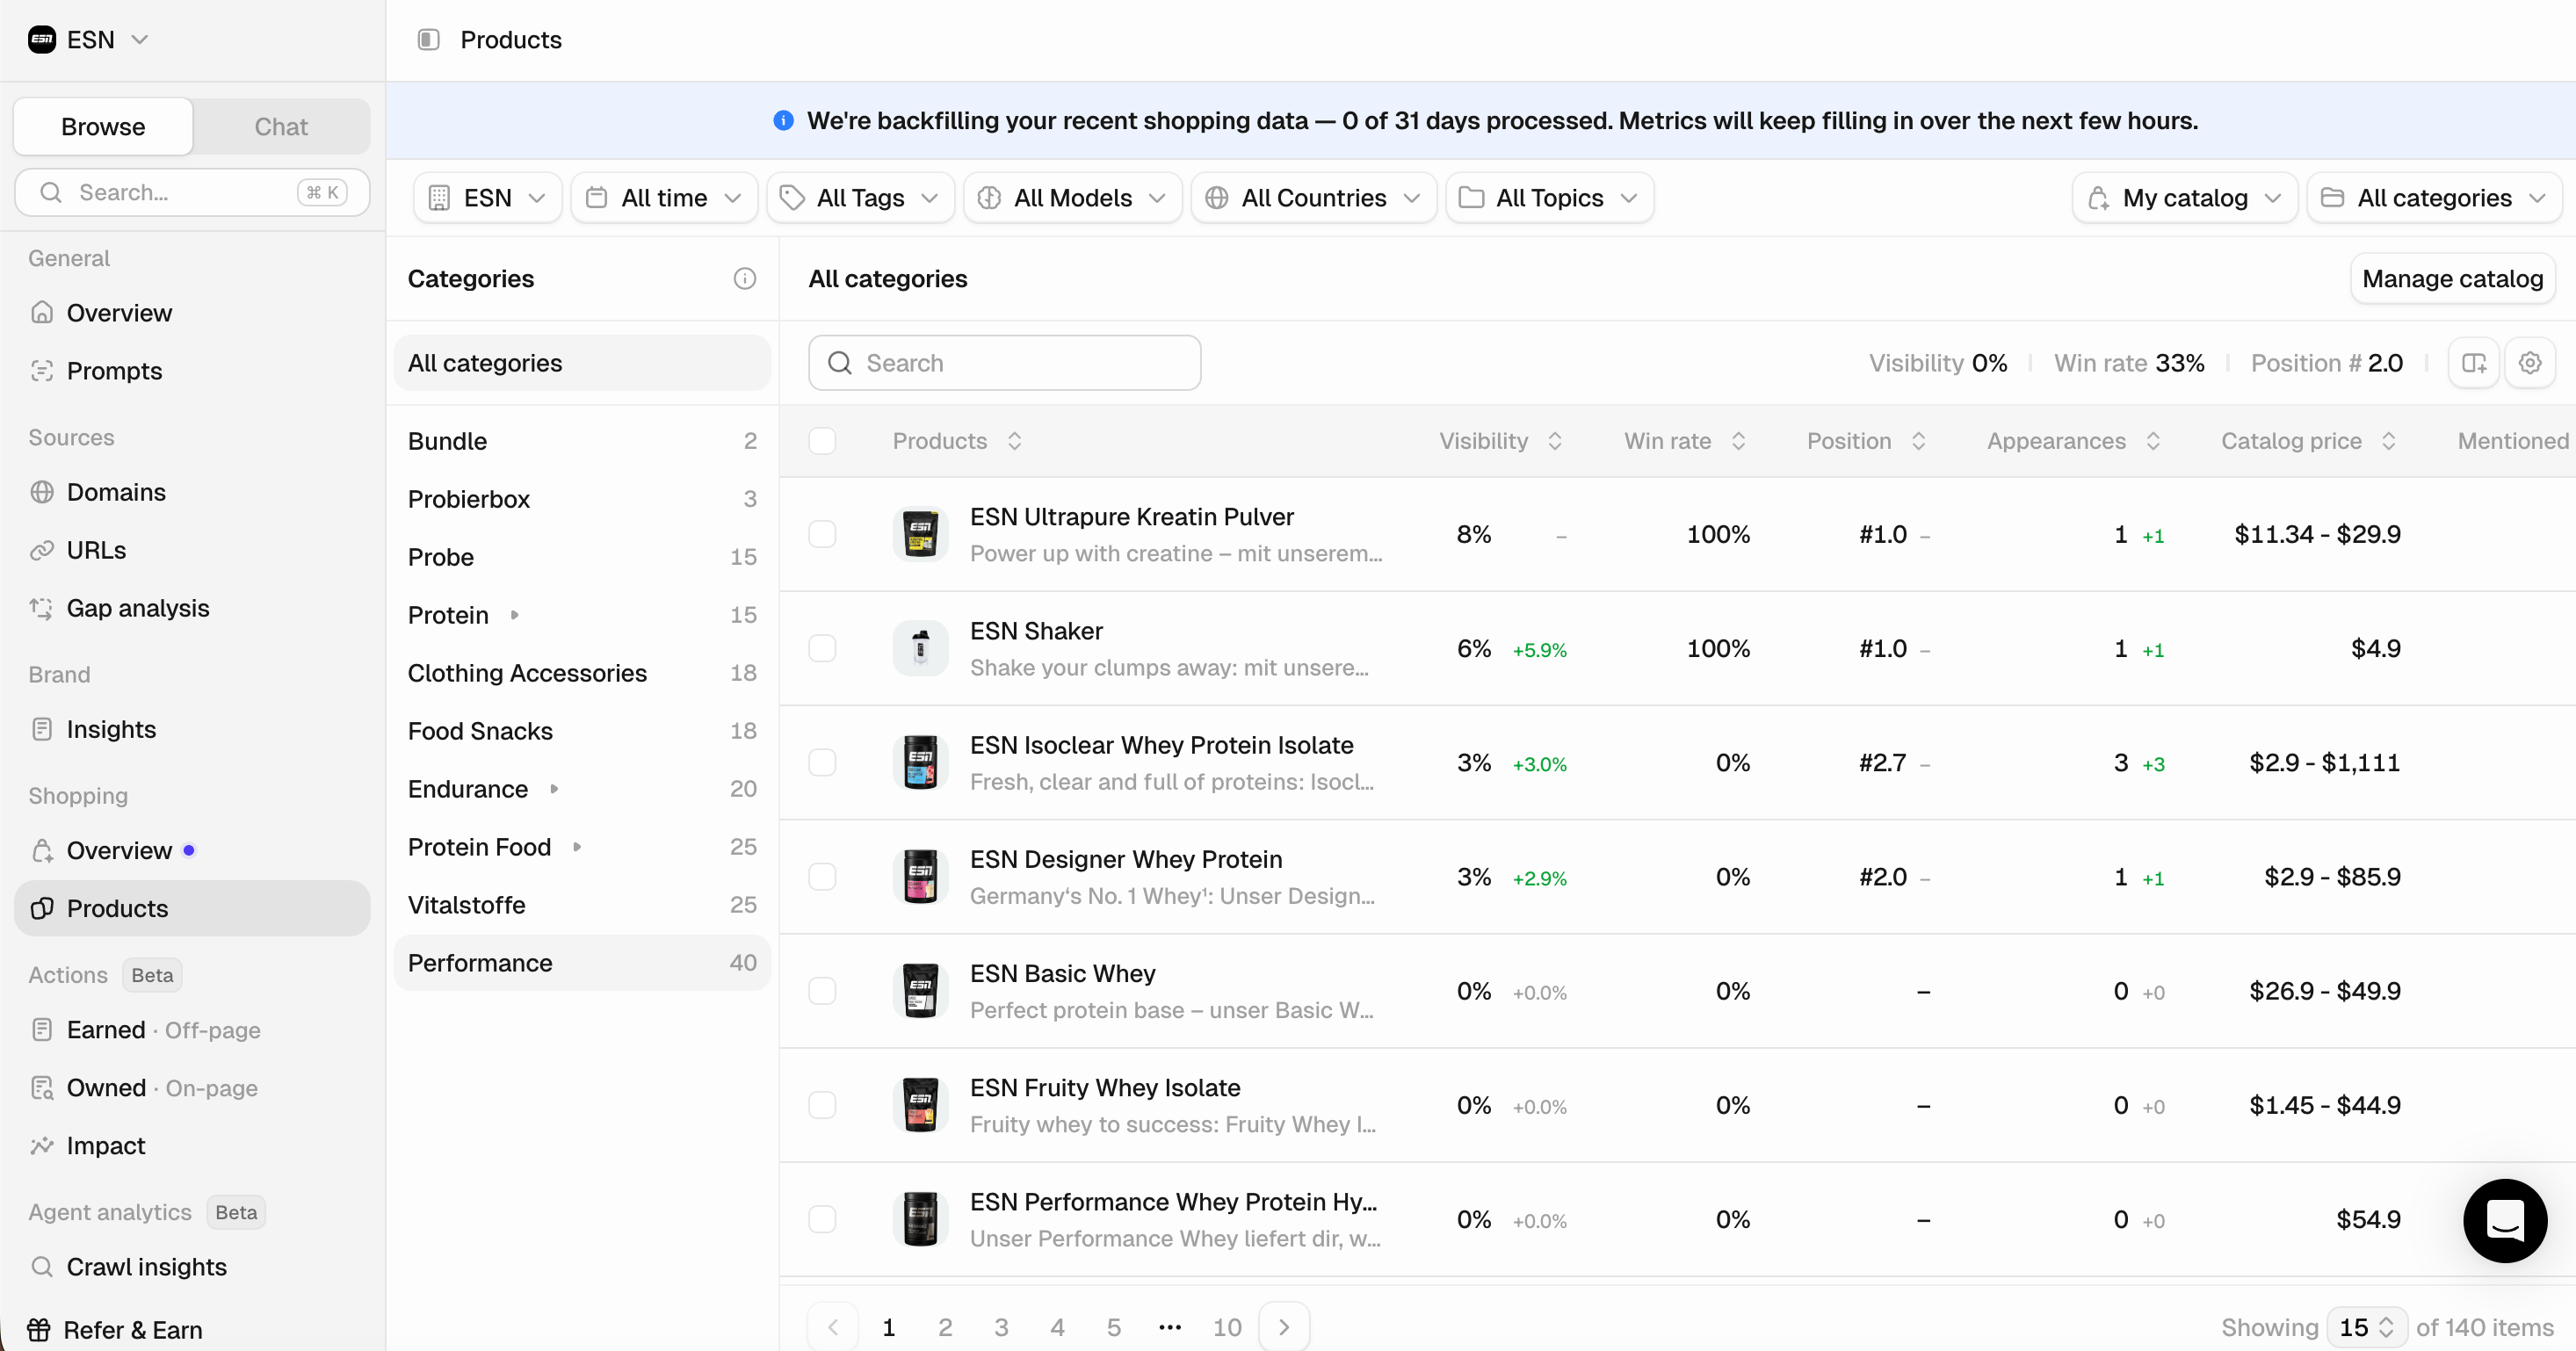
Position is the metric to watch. In a chat, users usually see the first two or three results before they have to scroll, and on mobile, that scroll is horizontal. A product that appears often but sits in position eight is barely seen.
Attributes
When ChatGPT compares products, it builds a table of attributes based on the user’s question and the context available to it. Peec captures those attributes and tracks how often each one appears across your chats. You can use this to:- Optimize your product detail pages: If the AI consistently evaluates products based on attributes you don’t mention on your own pages, it has less information to work with when deciding whether to recommend you.
- Cover the attributes that matter: By covering the attributes that matter most, you make it easier for the model to choose your product. For the full breakdown, see how each attribute is scored against competitors in the detail view.
Product detail page
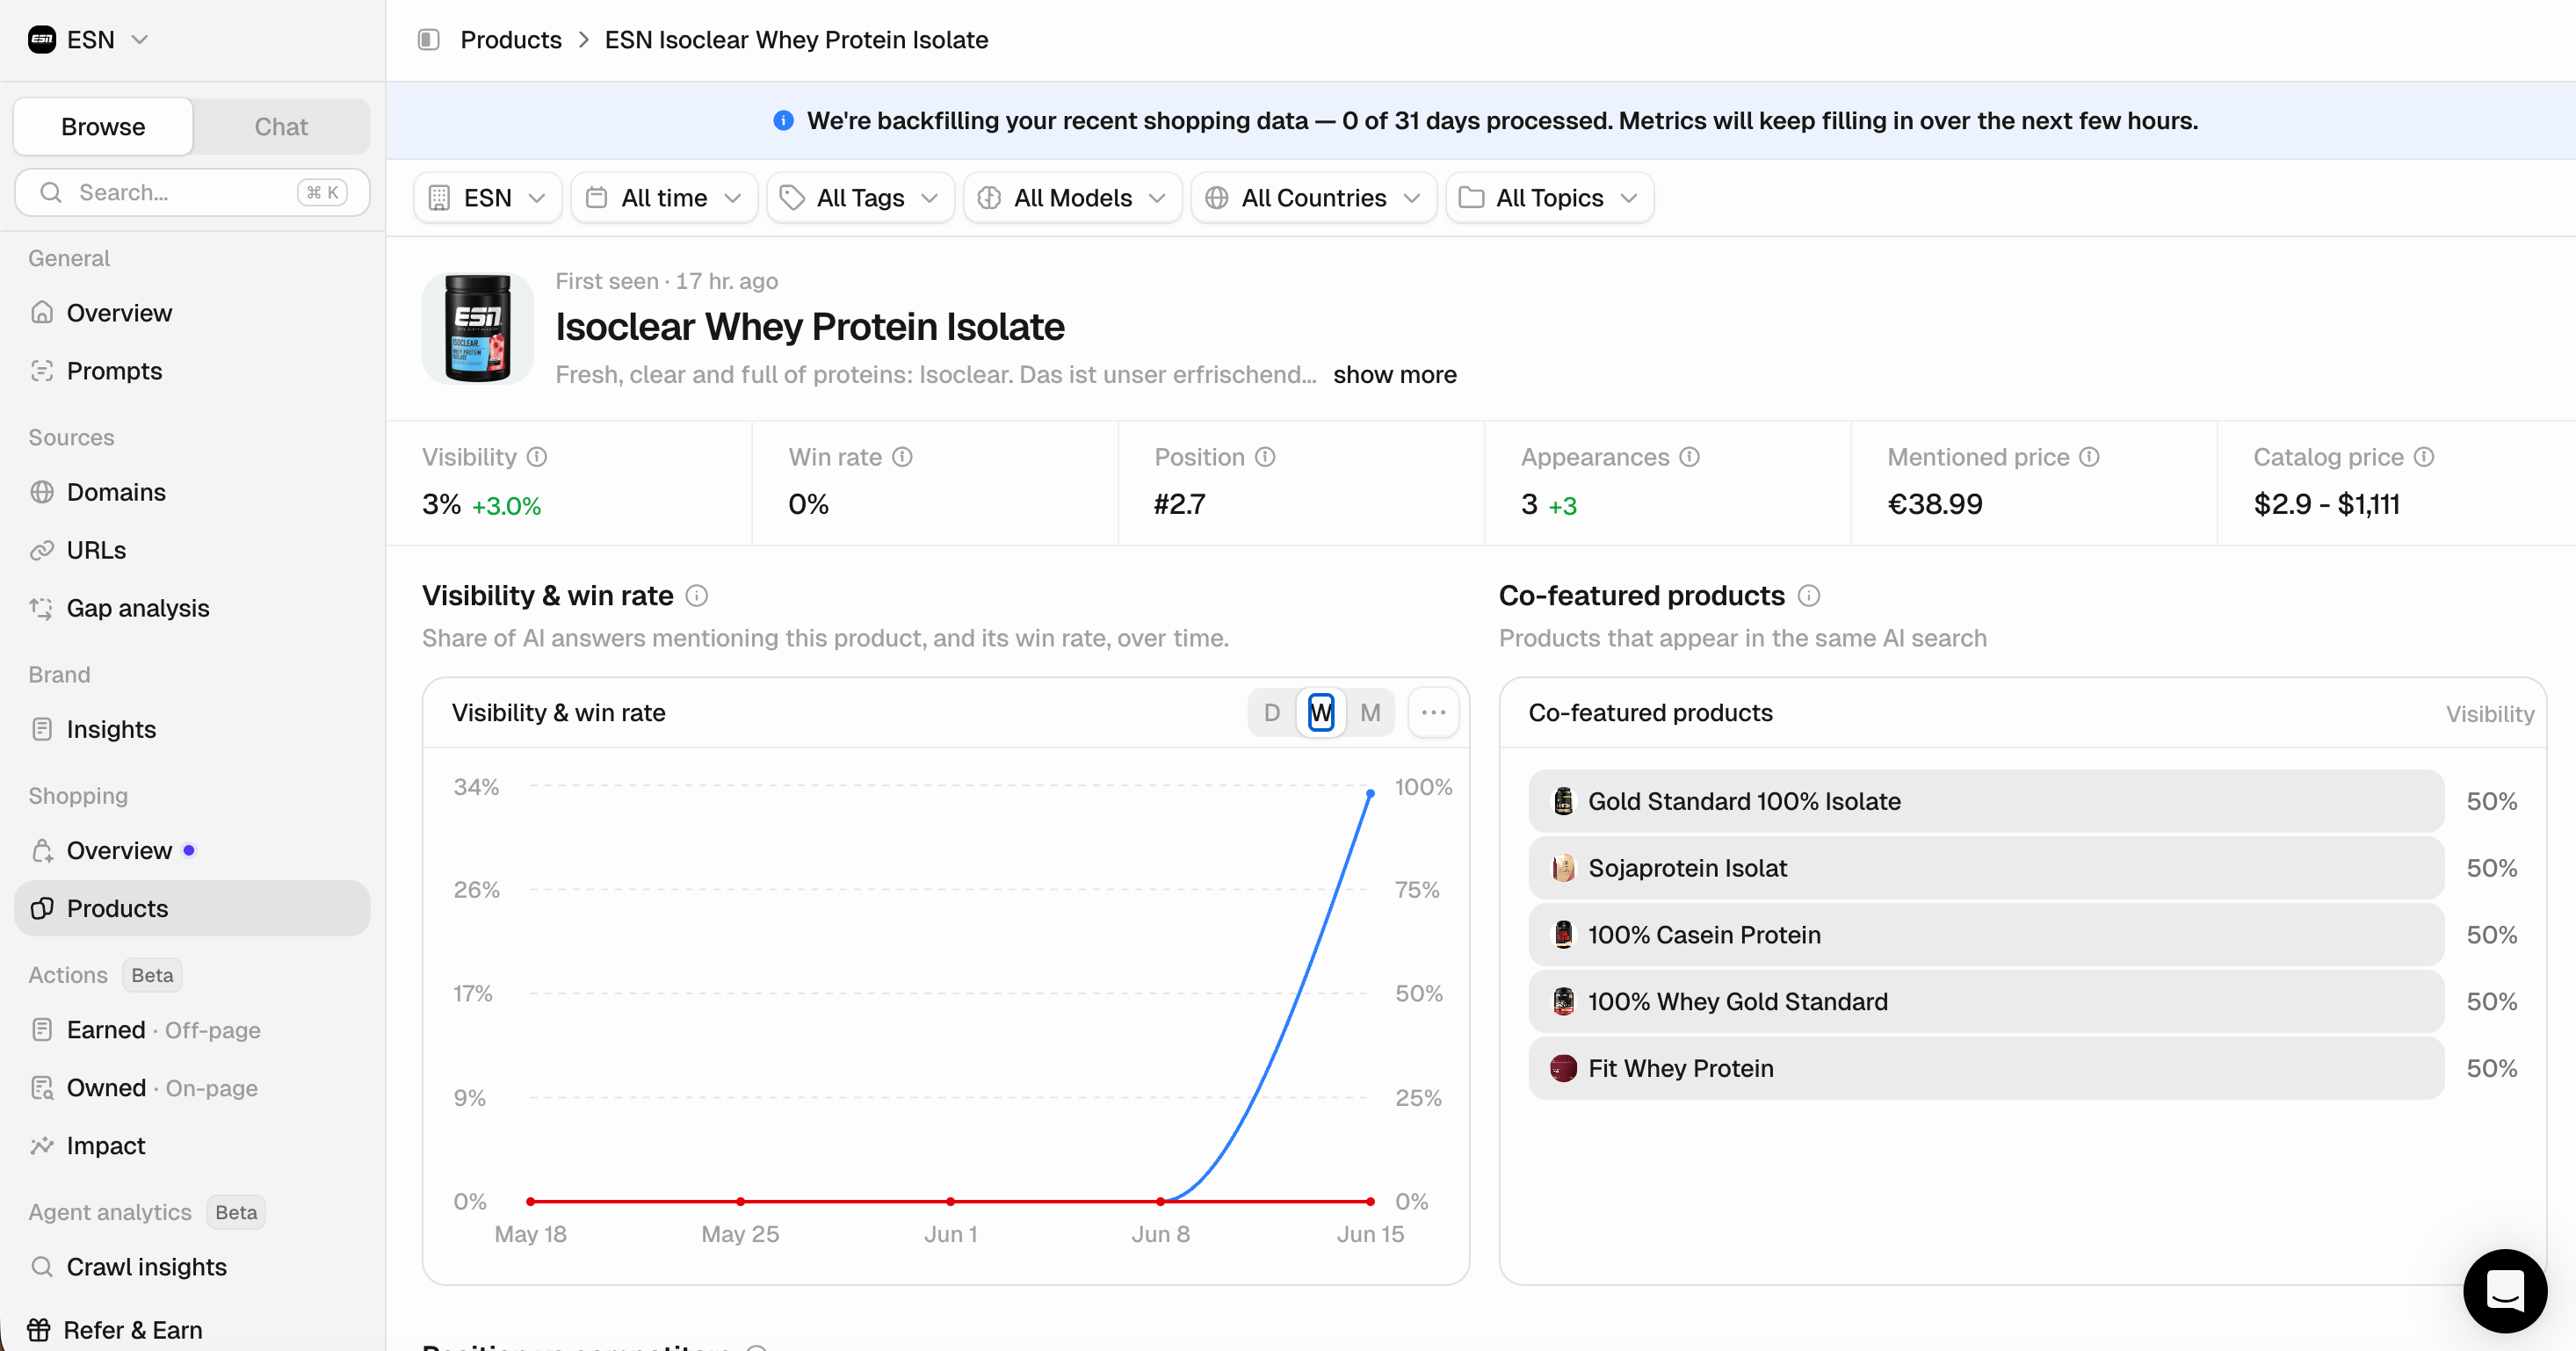
Main KPIs
A summary of the selected product performance over your chosen time period:- Visibility: Percentage of AI responses where this product appears.
- Win rate: The share of chats in which the product is the number one recommendation.
- Position: Average ranking when this product appears in AI responses (lower is better).
- Appearances: The absolute number of chats the product appeared in.
- Mentioned price: The price the AI cites for the product. Compare it to the catalog price to see whether assistants are quoting you higher, lower, or accurately.
- Catalog price: The price from your uploaded catalog.
Use the filters at the top to analyze more granularly.
- Co-featured products: The products ChatGPT recommends alongside this one. This is your real competitive set at the product level, not just the brand level. It tells you which specific products you’re being compared against in the same answer.
- Position versus competitors: A box plot of where this product ranks against the products it competes with, sorted by visibility. The plot shows more than the median position. It shows the variance and the outliers, too.
A product that doesn’t appear often but ranks well when it does looks very different from one that appears constantly in a weak position, and that difference is what tells you where to focus.
- Shopping queries: Total number of shopping searches for the selected timeframe. (Product carousels are built from Google Shopping category searches rather than web searches, making these queries the most important factor in improving your product’s visibility in carousels.)
- Fan-out queries: The web searches triggered alongside those chats, which the assistant uses to generate recommendations, reasoning, and comparisons. (Unlike shopping queries, which determine which products appear in the carousel, fan-out queries influence the content and context surrounding them.)
Attributes
When the AI compares products, it evaluates them on attributes. The Products table shows which attributes come up and how often; this section shows how your product scores on each one against its competitors. Attributes are split into three tabs by how the AI measures them:- Characteristics: These are attributes with text values. Expand one to see how often the AI mentions each value for you versus your competitors.
- Facts: These are yes/no and numeric specs that the AI states about each product.
- Ratings: These are attributes the AI scores on a scale, averaged per brand.
Prompts & chat table
- Prompts: The exact prompts this product appears in, along with visibility, position, and win rate for each. This gives you the clearest view of where you’re winning and where you’re losing. Sort by the metric that matters most to find the prompts worth optimizing.
- Chats: The actual AI conversations where this product appeared. Open any chat to read the full answer — what was asked, how the product was presented, and what else was recommended alongside it. If a metric surprises you, this is where you’ll find out why.