

Watch the full “Getting Started with Peec AI” playlist on Youtube
This quickstart guide gets you set up fast, so you can dive deeper into the platform with a solid data foundation. It takes less than 10 minutes, and you’ll have your first AI visibility insights within 24 hours.
Step 1: Setting up your prompts
Prompts are the questions you want to be found for in AI search. Peec AI runs them daily across AI platforms like ChatGPT and AI Overviews to see who gets mentioned.
Your task: Add your first 10 prompts.
Peec AI suggests prompts based on your brand and website (check the Suggested tab on the Prompts page, and use Topics to get better suggestions), or add your own with the Add button.
Examples:
- “What’s the best project management tool for creative agencies?”
- “Which CRM is best for marketing agencies under 50 people?”
- “How do I improve email open rates for B2B clients?”
Step 2: Identifying your competitors
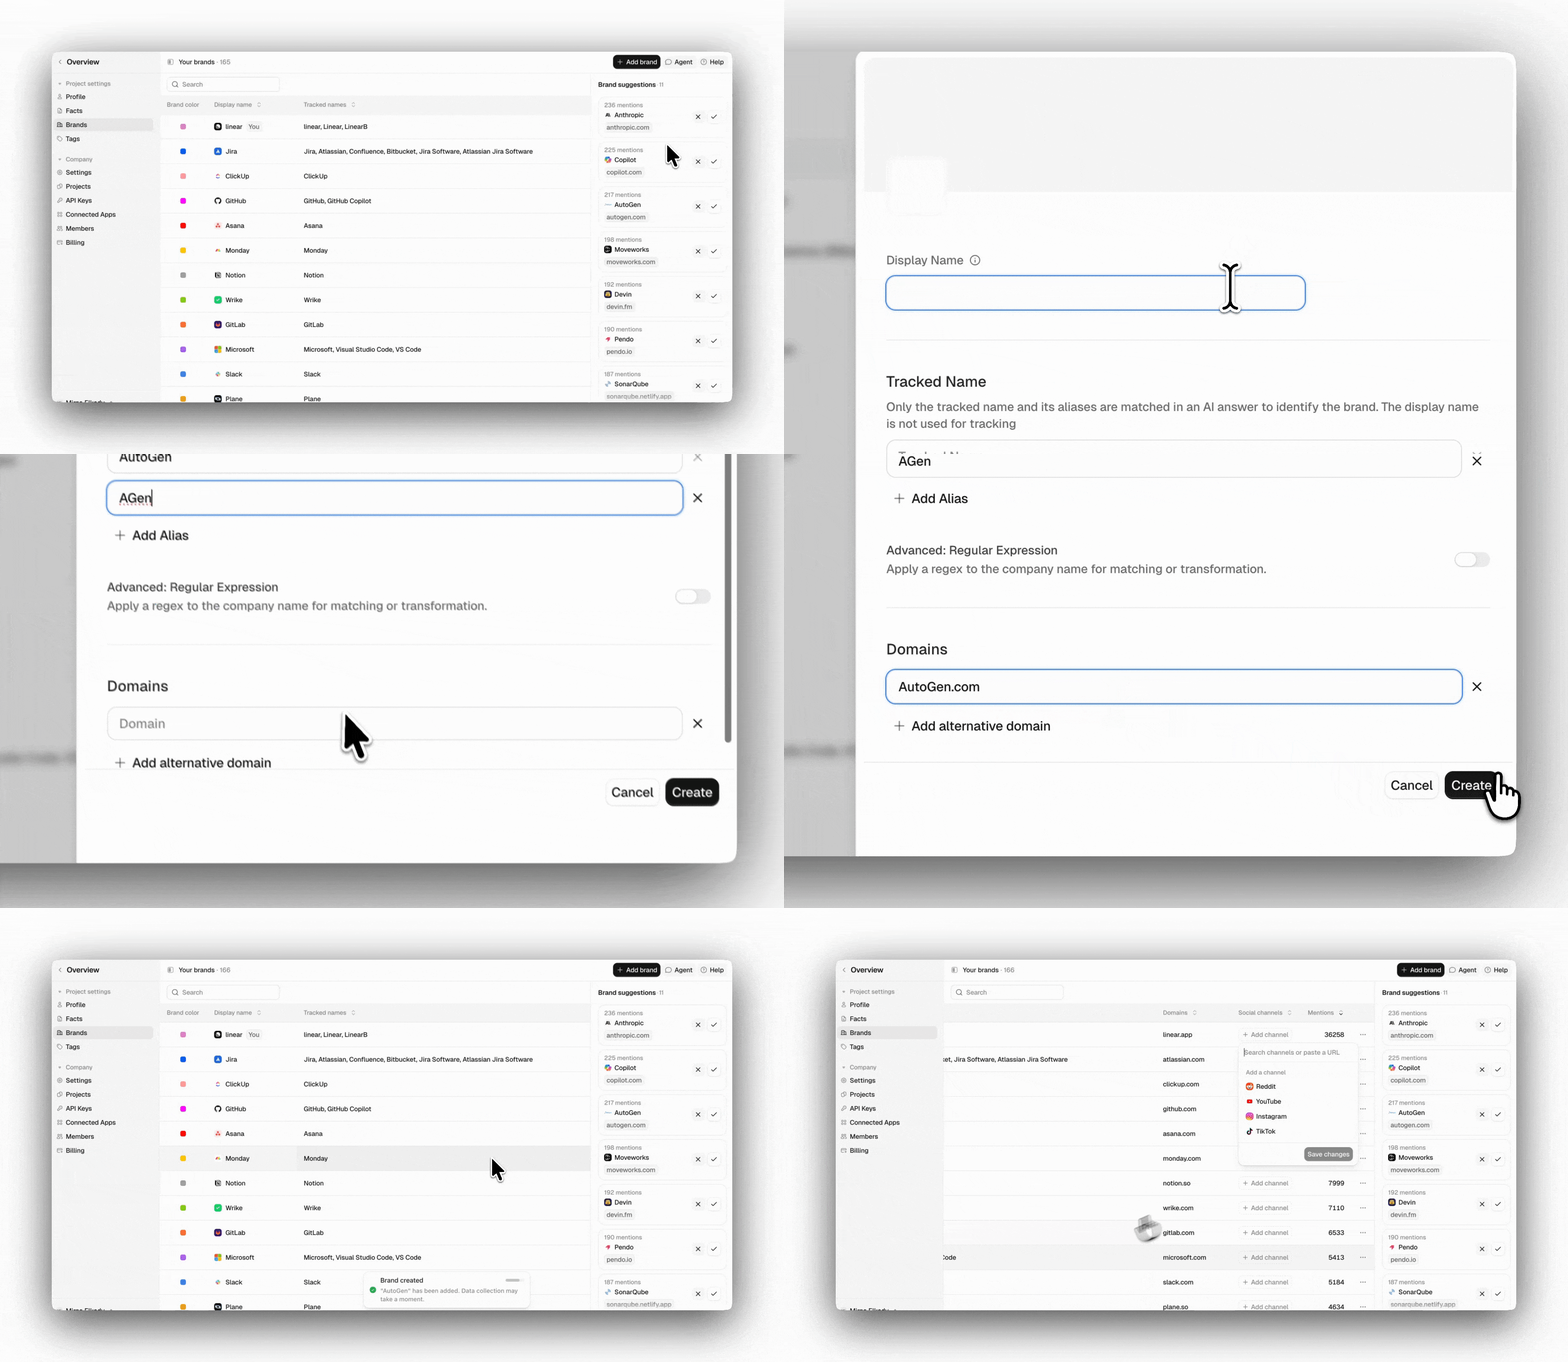
- Accept suggested competitors that Peec AI detects from your prompt responses, or use + Add brand to add your own.
- Select from the available social platforms and add the relevant handle, channel, or subreddit for your brand. You can also add channels for your defined competitors.
Important: Use the shortest unique brand name like “HubSpot” not “hubspot.com” or “HubSpot UK”, that’s exactly what we’ll track.If there are alternative spellings of a brand name, set them up as aliases.For complex cases requiring advanced pattern matching (dictionary words, case sensitivity, context requirements), see our Advanced RegEx section.
Step 3: Understanding your dashboard
Main dashboard view
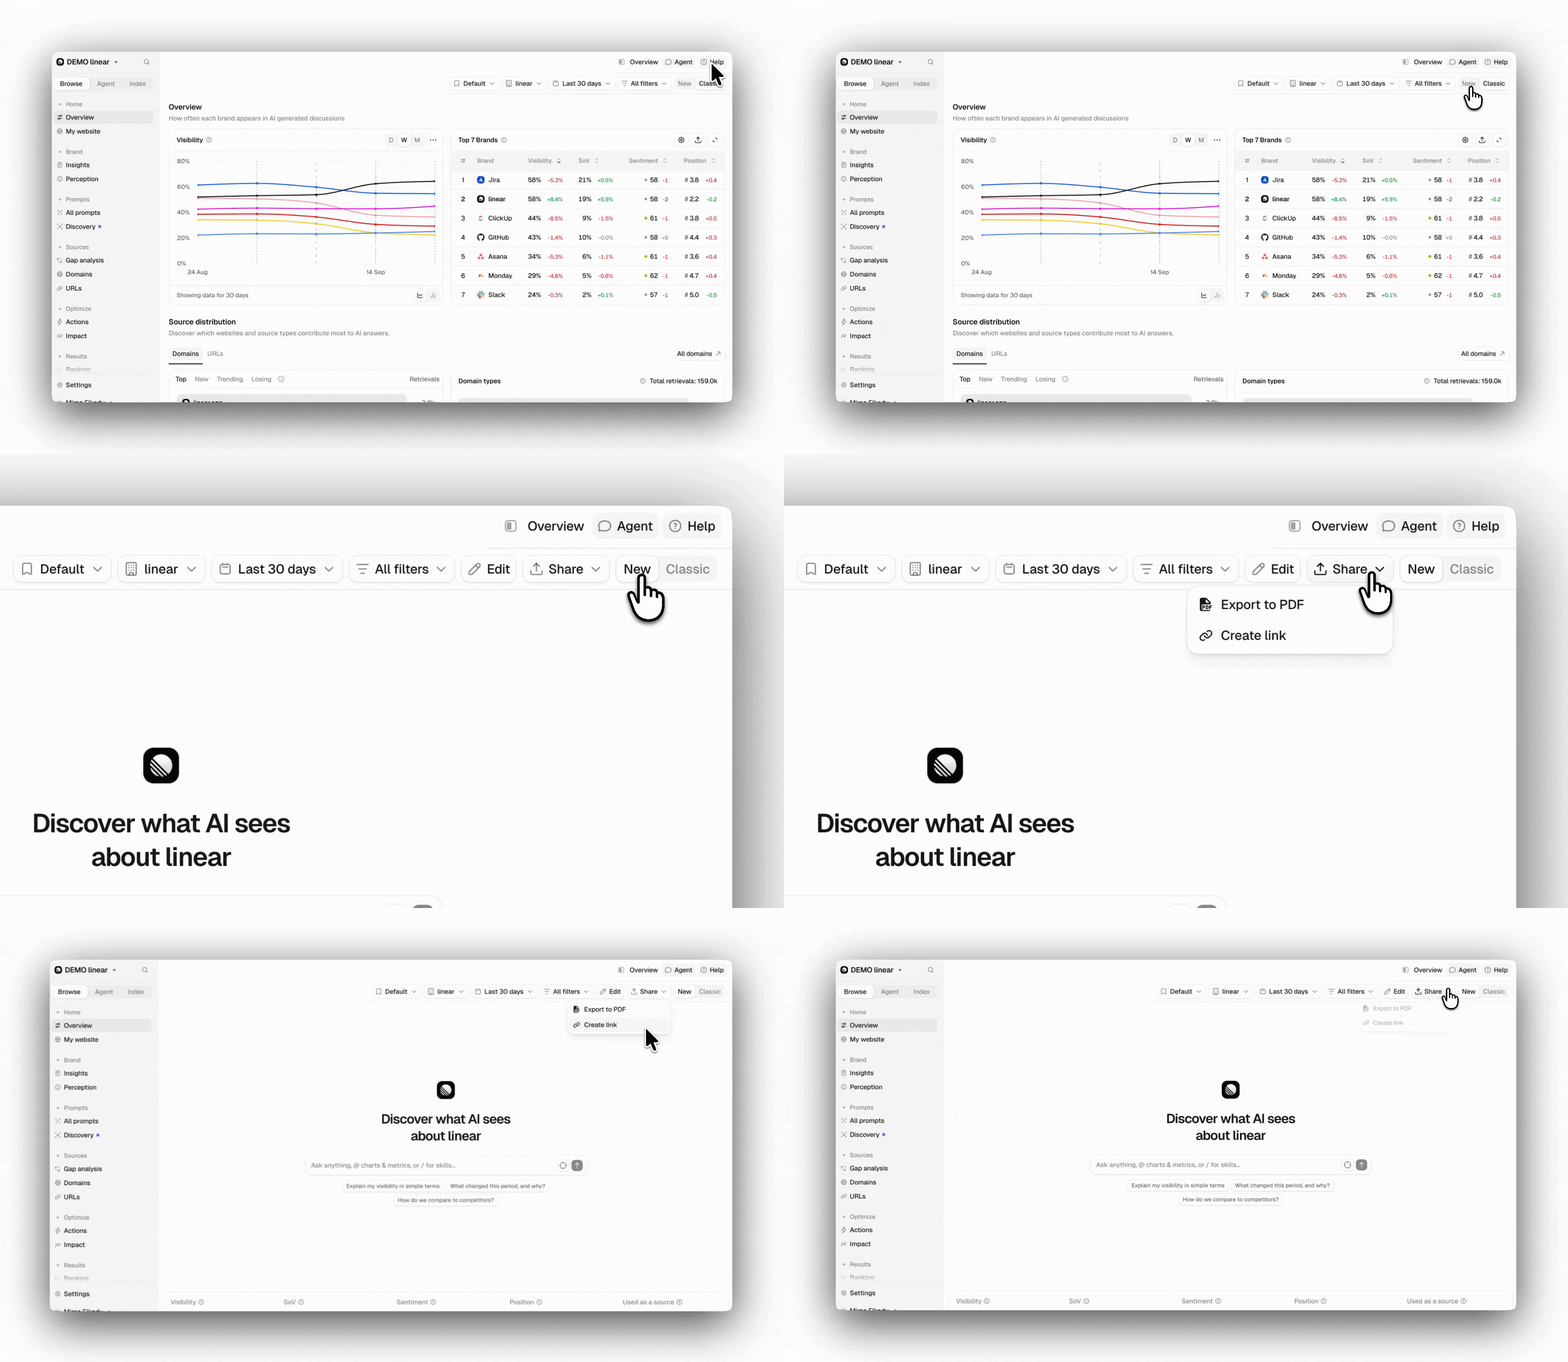
Your Overview dashboard shows your key areas once your prompts start running, within 24 hours. Toggle between Classic and New to switch layouts. In the Classic Overview, you can see:- Visibility graph: Percentage of chats mentioning each brand over time.
- Brands: Where you stand on visibility, share of voice, sentiment, and position scores compared to competitors.
- Source distribution: Which websites AI platforms reference across your prompts (split by source types and domains).
- Recent chats: Latest AI responses generated for your prompt set.
- Visibility: How often you appear in the AI answers generated for your prompt set.
- Sentiment: How positively AI describes you, on a 0 to 100 scale.
- Position: Your average rank when you do appear within the response. The lower the number, the better.
- Used as source: How often your own domains are used as a source in AI answers.
- Own source impact: Track how your visibility changes over time alongside how often your domains are cited as sources in AI responses.
- Top recommended actions: Prioritized opportunities to improve your visibility in AI search and improve your brand’s performance across the AI models.
- Performance matrix: Compare metrics across different dimensions.
- Source distribution: The types of sources AI is retrieving to generate its answers.
- Recent chats: Latest AI responses generated for your set of tracked prompts.
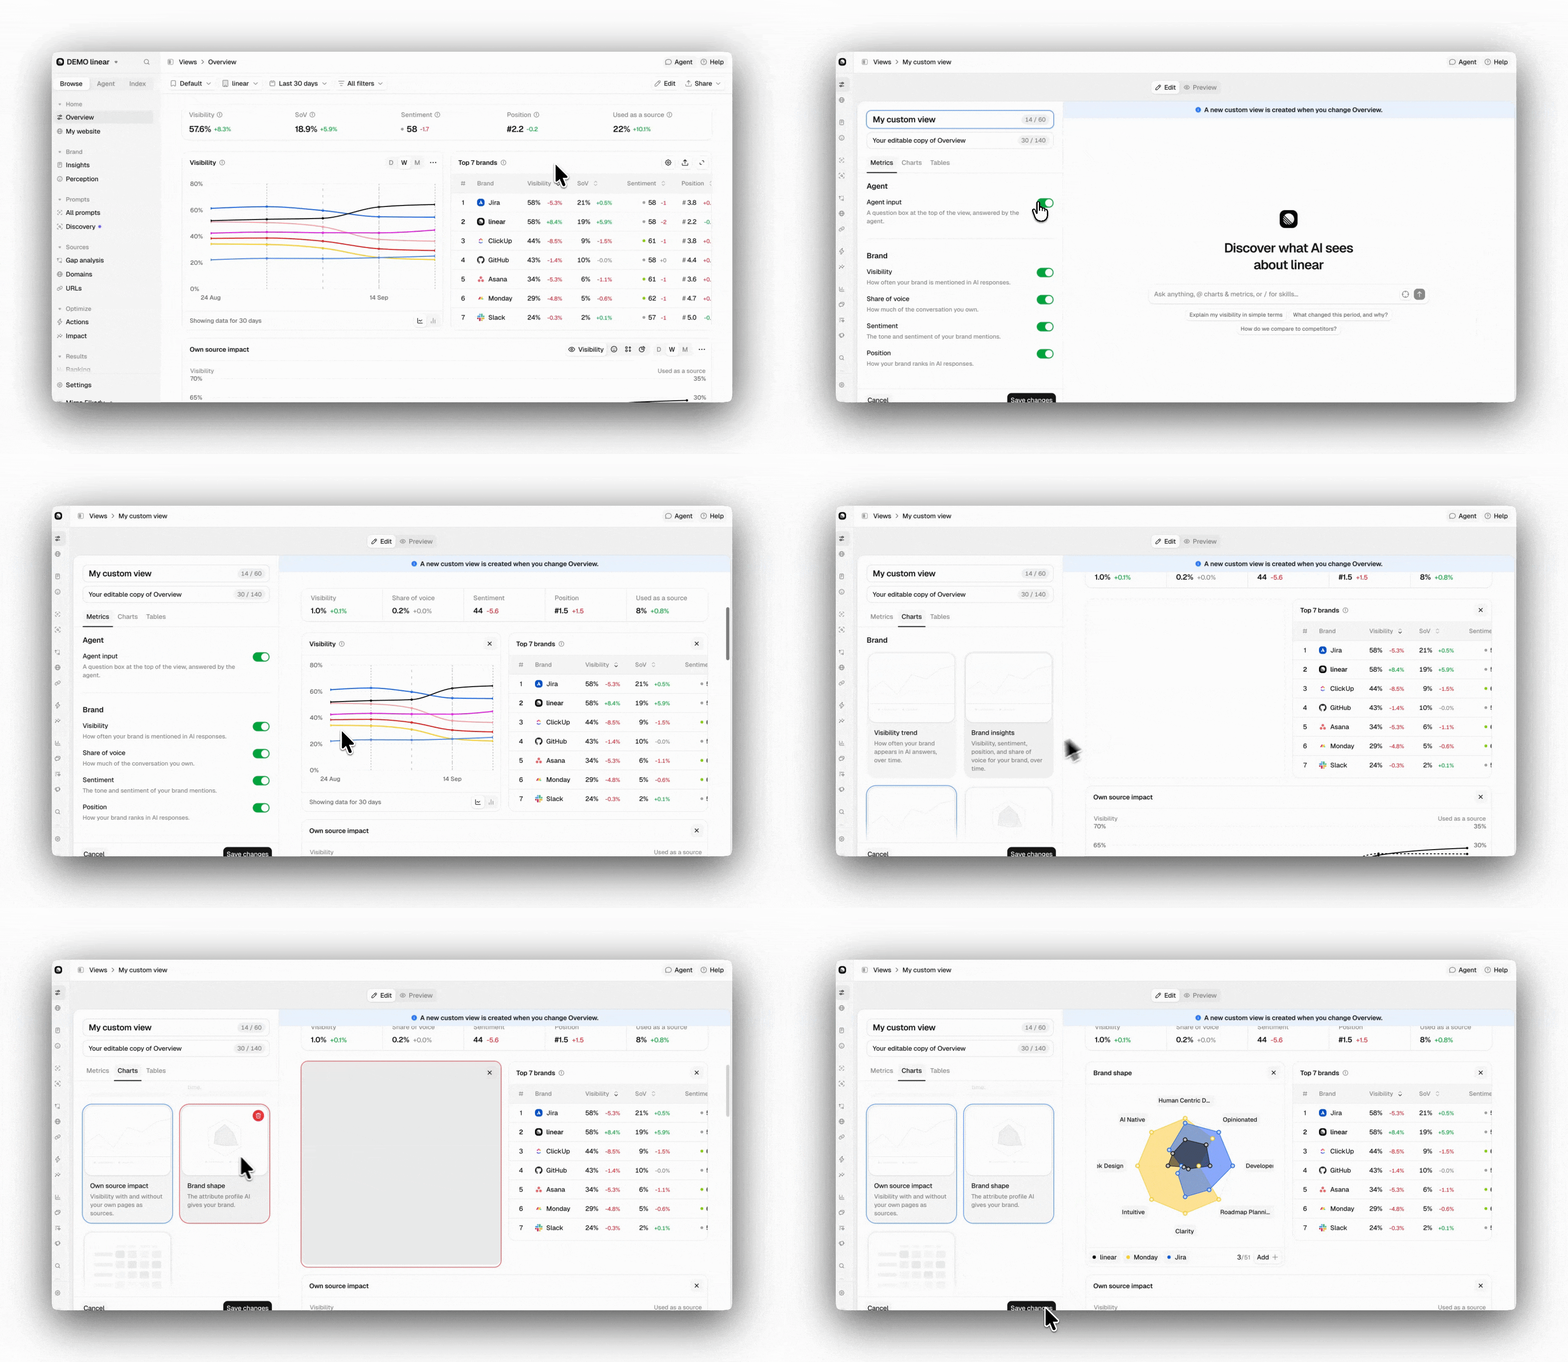
- Add element: Add an element to an existing section. Use Add element to create a new section.
- Rearrange and resize: Drag widgets to reorder them, or drag their edges to resize. A width of 6 columns takes up half a row, while 12 columns span the full row.
- Delete element: Click on the “x” at the top-right corner to delete an element.
Your layout is personal. Changes are saved to your own account for this project, so rearranging the Overview won’t affect your colleagues’ layouts.
- Password protection: Add a password to restrict access to the public link.
- Export as PDF: Download the current dashboard as a PDF to share in reports or presentations.
A shared link always displays the latest dashboard data. If you need a fixed version that won’t change over time, export the dashboard as a PDF instead.Turning Sharing off permanently disables the current link. If you enable sharing again later, a new public link will be generated.
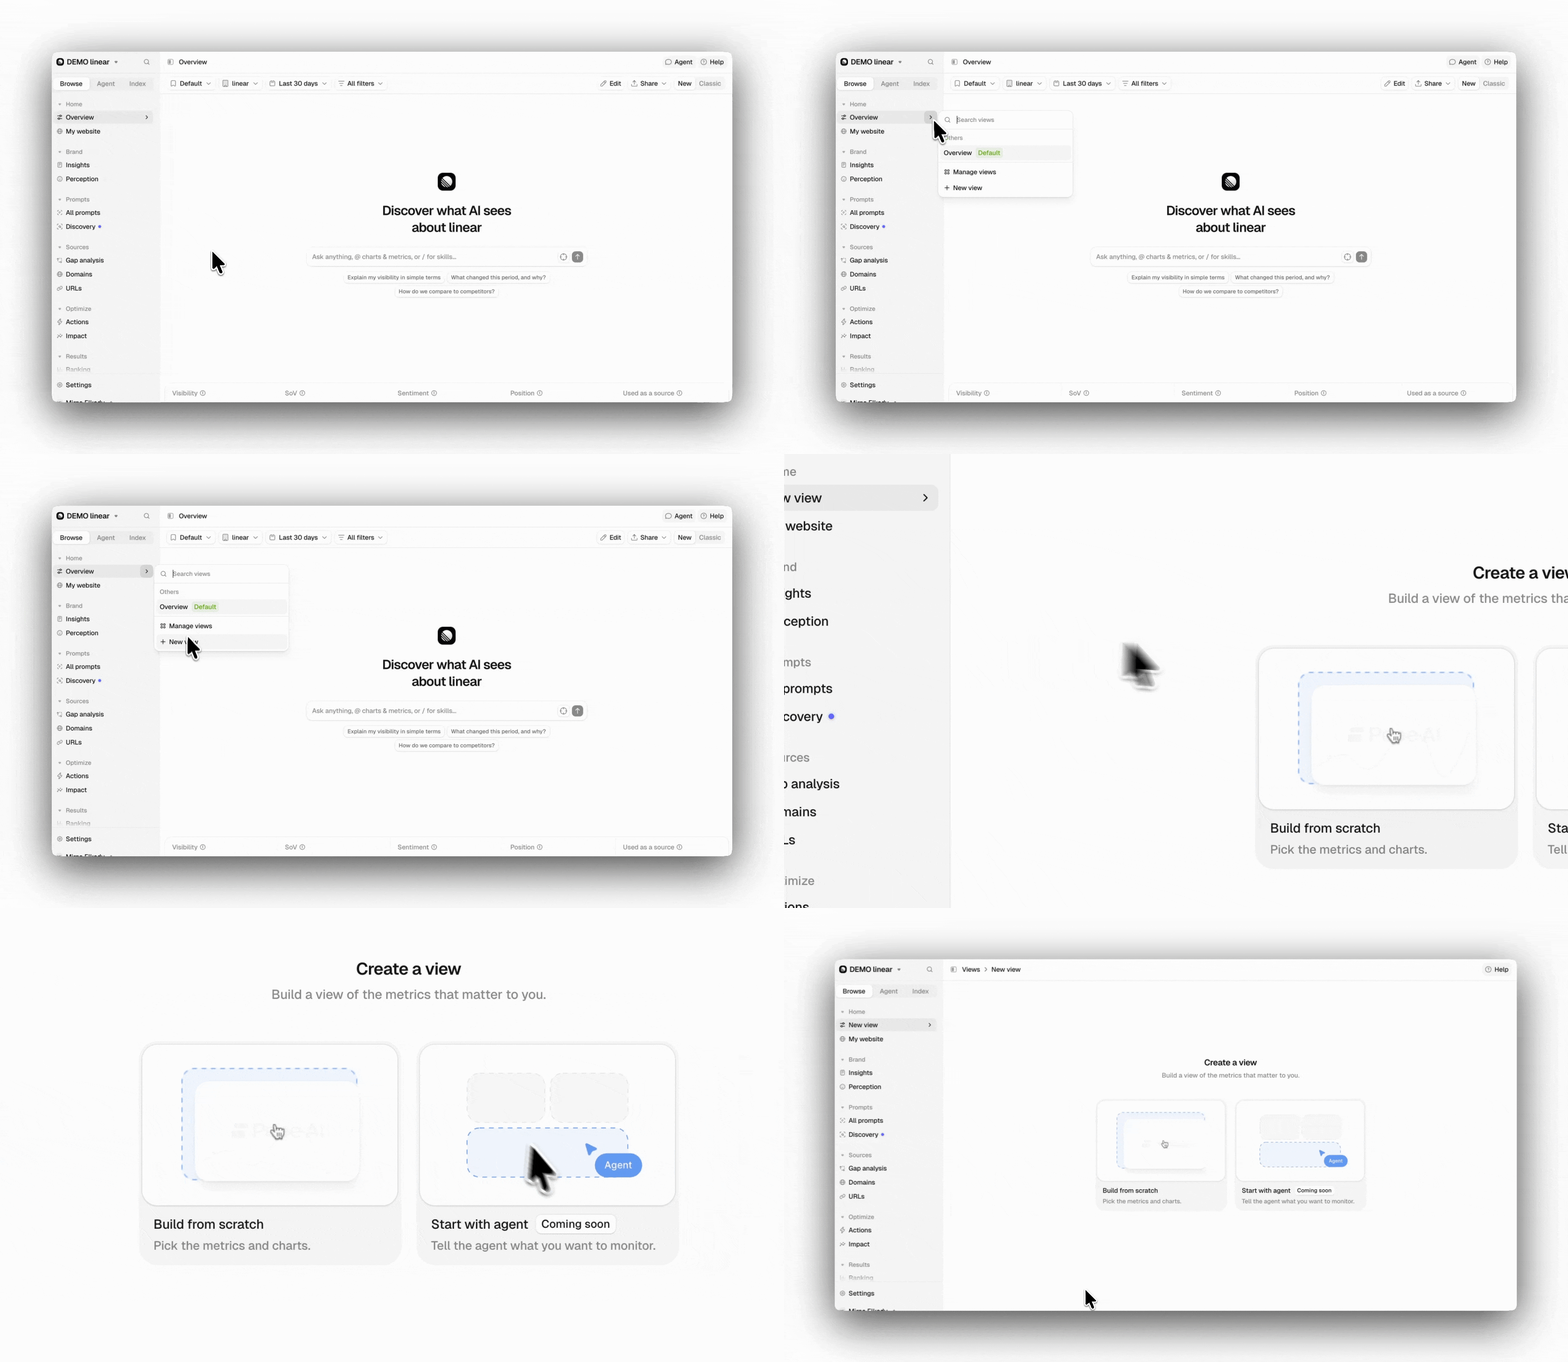
- Create a view: Choose how you want to get started:
- Build from scratch: Open the builder and choose the metrics and elements you want to include.
- Start with agent: Describe what you want to monitor, and the Agent will create a starting layout for you.
- Find your views: All the views available to you are collected in the views list, making it easy to return to them whenever you need. Use the All and Bookmarked tabs to browse your views, or search for a specific one. You’ll also see views your colleagues have shared with you, along with the name of the owner, so you can easily find and reuse layouts your team has already created.
Both options create the same customizable view, with full control over layout, resizing, and sharing. Unfinished views are saved as drafts, which you can resume or discard later.
Step 4: Understanding your sources
When AI platforms search the web for answers, Peec AI captures those sources. They are your biggest opportunity for improvement.
Your task: Check the Sources page to see which domains and URLs appear most frequently.
You can switch between Domains view (like nytimes.com) and URLs view (specific web pages).
As you review the domains, look for opportunities such as:
- Competitor sites appearing frequently → consider similar content topics.
- Industry publications you’re not in → reach out for coverage or guest posts.
- Your own URLs appearing → double down on that content format.
- High “Used” percentage domains → these are authoritative sources worth targeting.
What’s next?
Once you are familiar with the basics, you can move on to:- Learn the strategy: Navigate to our section “How to use source insights” to find out how to work with your source data for maximum impact.
- Perfect your prompts: Dive deeper into the Prompts section for advanced setup tips and strategic approaches to get even more valuable insights from your tracking.