Watch “Organizing your setup” on YouTube
As your prompt collection grows, you need systematic ways to handle them at scale. Prompts operate at different levels — active, archived, and deleted — each serving different purposes.
Breaking prompts into organized chunks becomes essential because these groupings form the foundation of your analysis. Effective organization means you can quickly compare performance across categories instead of drowning in hundreds of individual prompt results.
Manage your prompts
We’ve made it easy for you to manage prompts with batch actions. Different ways you can select multiple prompts:- Click the checkboxes next to individual prompts.
- Hold the shift key and click on another checkbox to select multiple at once.
- Tick the checkbox in the top row to select all prompts on the page.
Use search to filter prompts before selecting for easier bulk actions.
- Assign Tags: Add tags to multiple prompts simultaneously.
- Assign Topics: Move prompts to different topics (one topic per prompt).
- Archive: Archive multiple prompts while still preserving data.
- Assign Tags and Topics: Same as above.
- Activate: Restore prompts to active status.
- Delete: Permanently remove prompts and all associated data. Only use if necessary.
Understanding prompt states:
- Active: We run the prompt against AI models once a day and include it in analytics.
- Archived: We don’t run it anymore, but keep all chat history and sources in analytics.
- Deleted: We remove everything associated with that prompt and treat it as if it never existed.
Add your tags and topics
Both tags and topics help you organize prompts, but they work differently and serve complementary purposes. Tags let you add multiple labels for analysis, while topics group prompts into folders and generate better prompt suggestions based on your chosen topics.Understanding tags vs topics
Tags: Tags are dimensions you can use to slice and dice your data for granular views of your brand visibility. One prompt can have multiple tags. For example: “email-marketing,” “enterprise,” “decision-stage,” “q4-campaign.” Tags give you flexible categorization for analysis:- Filter by single tags or combinations (with AND/OR conditions)
- Compare performance across categories
- Export data by tag groups
- Handle overlapping attributes (one prompt can be both “enterprise” and “decision-stage”)
You can refer to our Helper Article “Part 2: Using tags effectively” for some best practices
- Track visibility at the topic level.
- Generate new prompt variations based on topics.
- Filter and segment prompts more effectively.
TLDR: Tags vs Topics
- Tags: Multiple per prompt, flexible filtering (like Gmail labels).
- Topics: One per prompt, visual folders (like file folders).
Branded and Intent classification tags
Alongside the tags you create yourself, Peec automatically assigns two special classifications to every prompt: Branding and Intent Type. These appear as dedicated columns on your prompts table and are assigned by Peec in the background when a prompt is created. You do not need to set them yourself.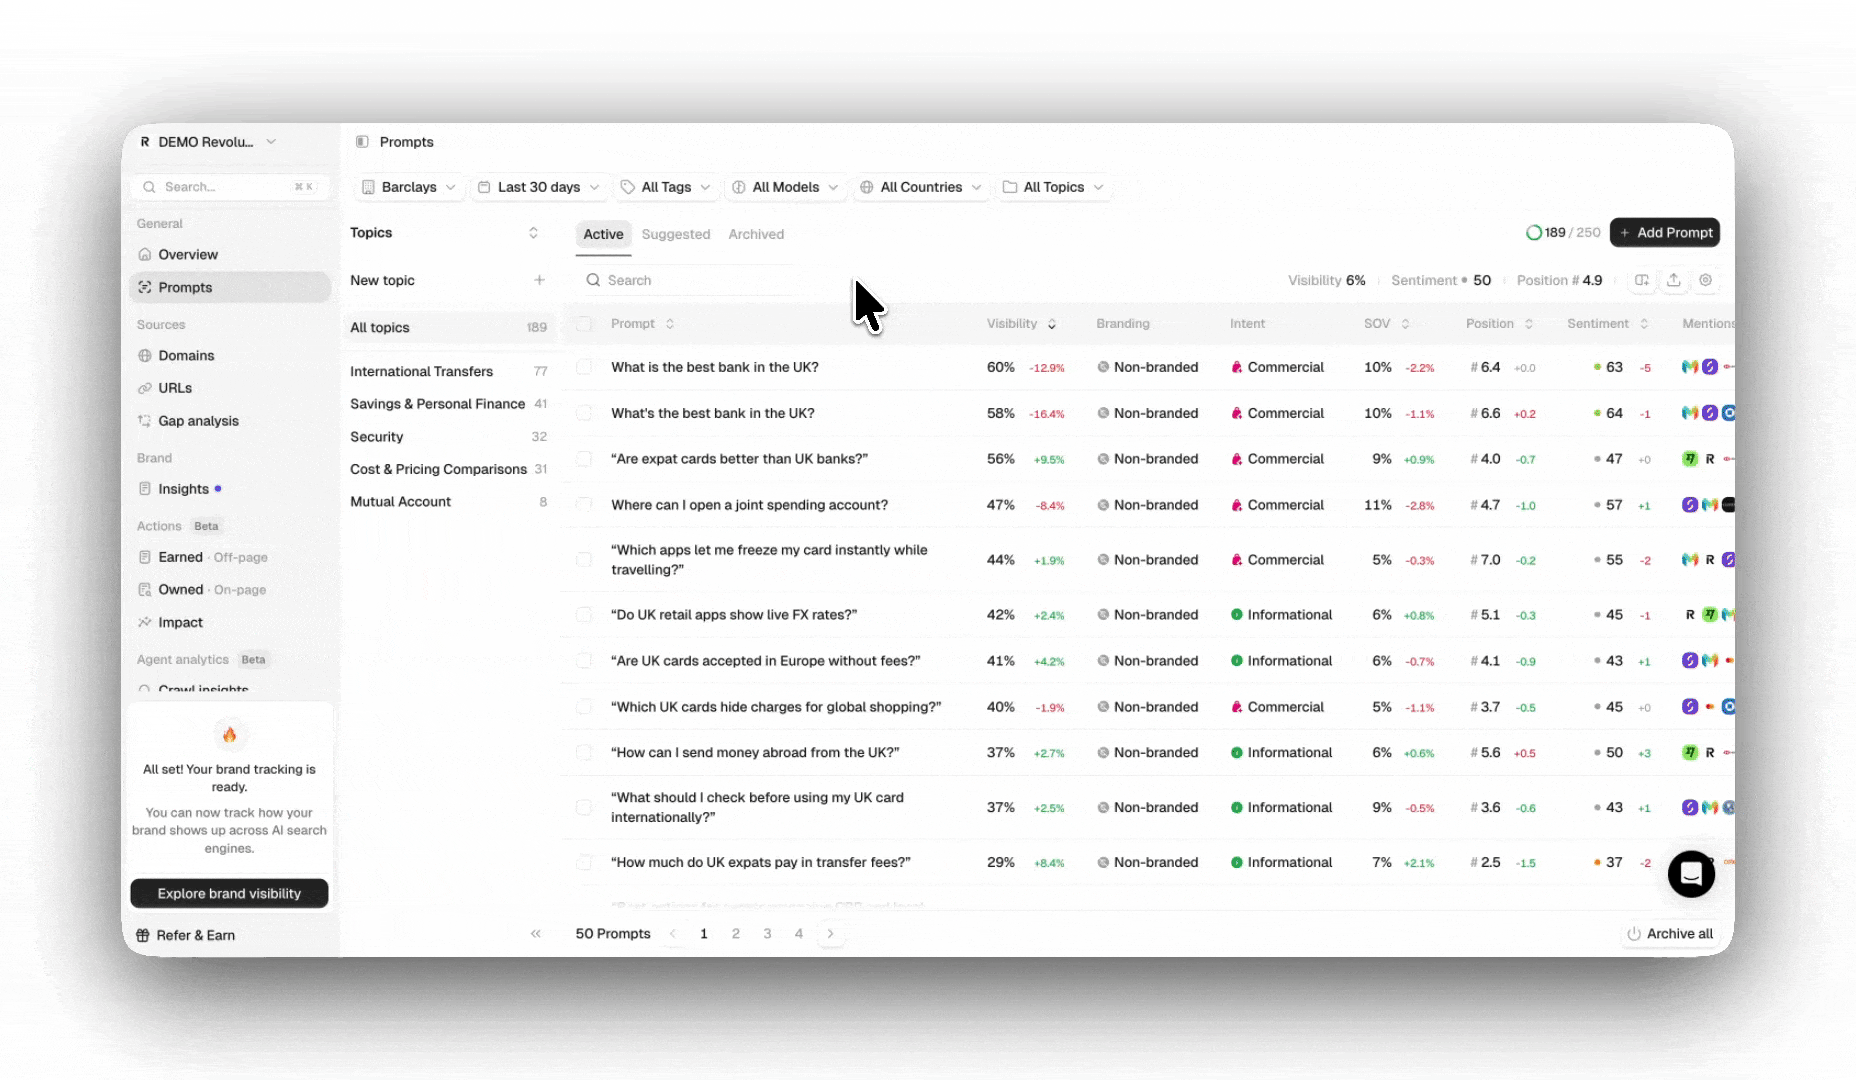
- Branded: The prompt mentions your brand or any competitor directly. (E.g., “What is HubSpot?” or “HubSpot pricing.”)
- Non-branded: The prompt is a generic question with no explicit brand mention. (E.g., “best CRM software” or “how to manage customer relationships.”)
- Informational: The user wants to understand something. (E.g., “what is CRM software” or “how does email marketing work.”)
- Commercial: The user is comparing options. (E.g., “best project management tools” or “HubSpot vs Salesforce.”)
- Transactional: The user is close to a decision. (E.g., “HubSpot pricing” or “buy CRM software.”)
- For example: filter for non-branded + commercial prompts to find topics where you have a visibility opportunity but no direct brand pull.
Branded and Intent classifications are separate from the tags you create yourself. They cannot be renamed, but they can be reclassified on a prompt basis. Each prompt gets exactly one value per group. If a prompt shows no value in either column, classification is still running and fills in automatically within a short time.
Rearrange metrics on your prompts table
Tables in Peec can be customized and sorted by nearly any available metric. In your prompts, you will find multiple metrics that you can add to the table you are interested in. You can choose which items to show or hide in your table. You can also rearrange the table so your most relevant metrics always appear first. To return to your previous view, open the table settings and click Reset to default view. Besides your usual metrics, you can also see:- Shopping: The percentage of chats that have triggered a shopping carousel
- Product Comparison: The percentage of chats where AI compares multiple products
- Images: The percentage of chats that include an image
- Ads: The percentage of chats that have triggered an Ad
- Map: Percentage of chats that have displayed a map within the answers
- Web Search: The percentage of chats that have actually triggered a web search
Please note that these metrics (in comparison to your main ones like Visibility, SoV, Position, and Sentiment) are independent of whether your brand is mentioned.