Overview
The Brand Insights page has six main KPIs. Each of them will give you a different view of your brand and competitors.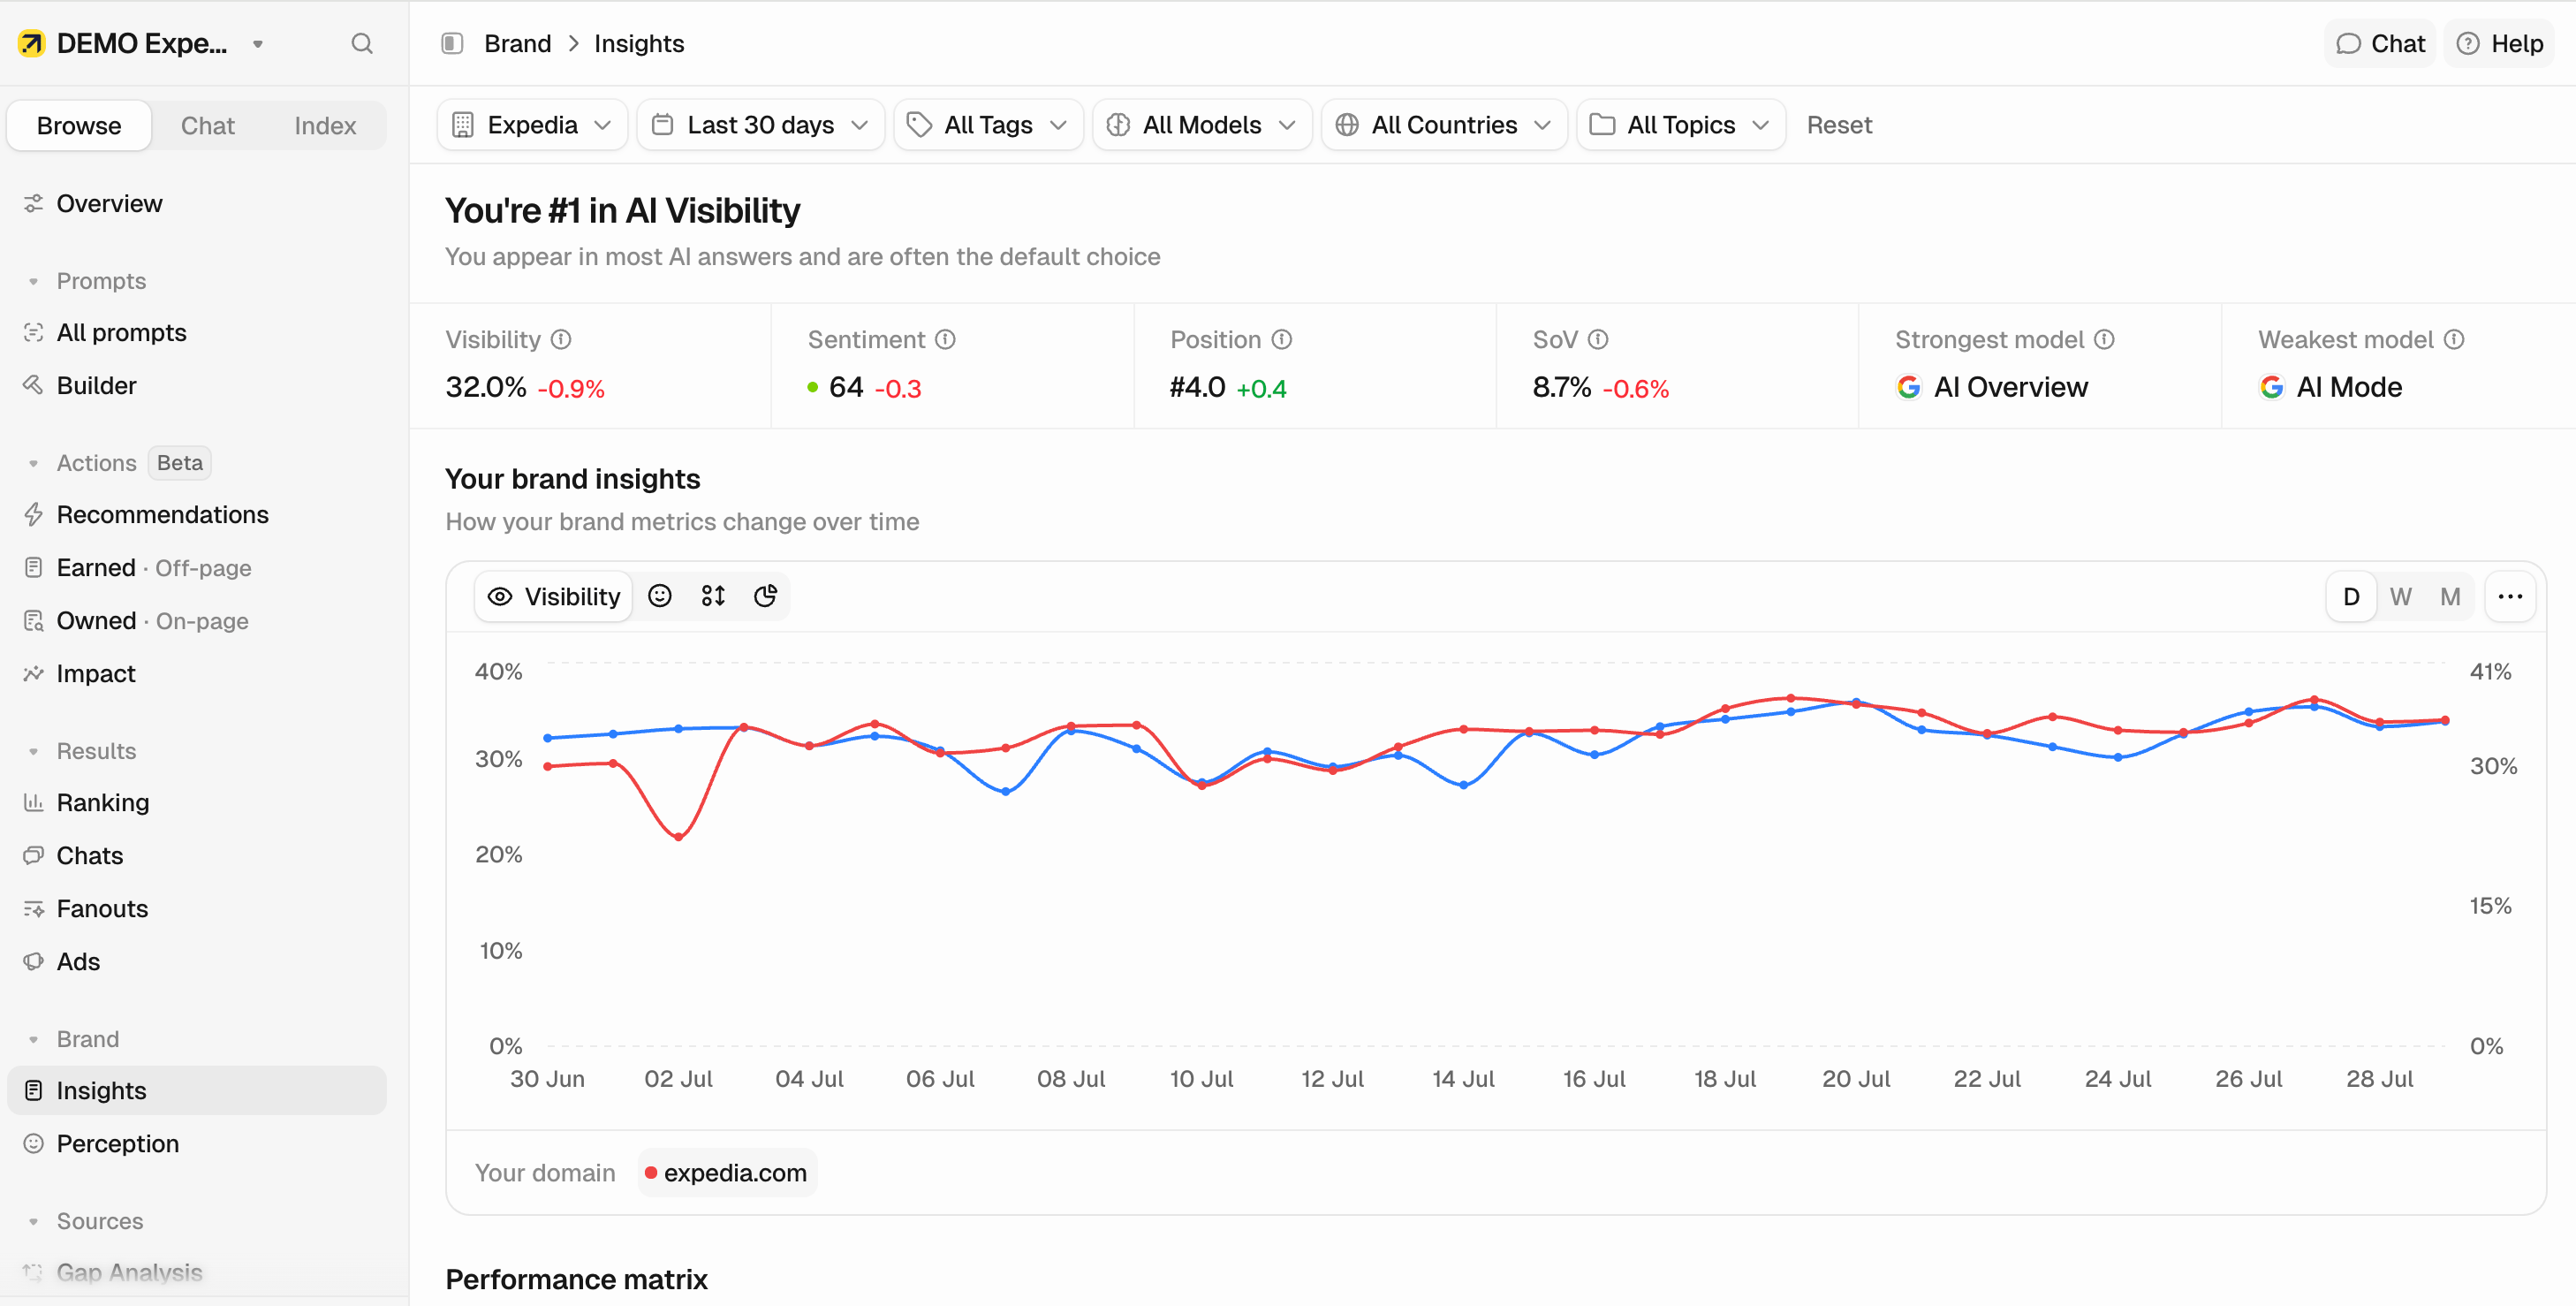
Main KPIs
A summary of the selected brand’s performance over your chosen time period:- Visibility: Percentage of AI responses where this brand appears.
- Share of Voice: This brand’s share of all brand mentions across your tracked prompts.
- Sentiment: How positively AI platforms describe this brand (0–100 scale).
- Position: Average ranking when this brand appears in AI responses (lower is better).
- Strongest / Weakest model: The AI model where your brand performs best, based on combined visibility, sentiment, and position.
Brand insights graph
The graph shows the brand’s performance over time. Toggle between Visibility, Sentiment, Position, and Share of Voice to see trends for each. It also overlays your retrieved percentage, so you can see how often your own domains are pulled into AI answers alongside the selected metric. Choose which of your domains to display, and compare brand authority against domain authority over time. Vertical markers on the chart flag events like new prompts being created or an AI model change.
Switch between Daily, Weekly, or Monthly timeframes using the selectors in the upper-right corner of the graph.
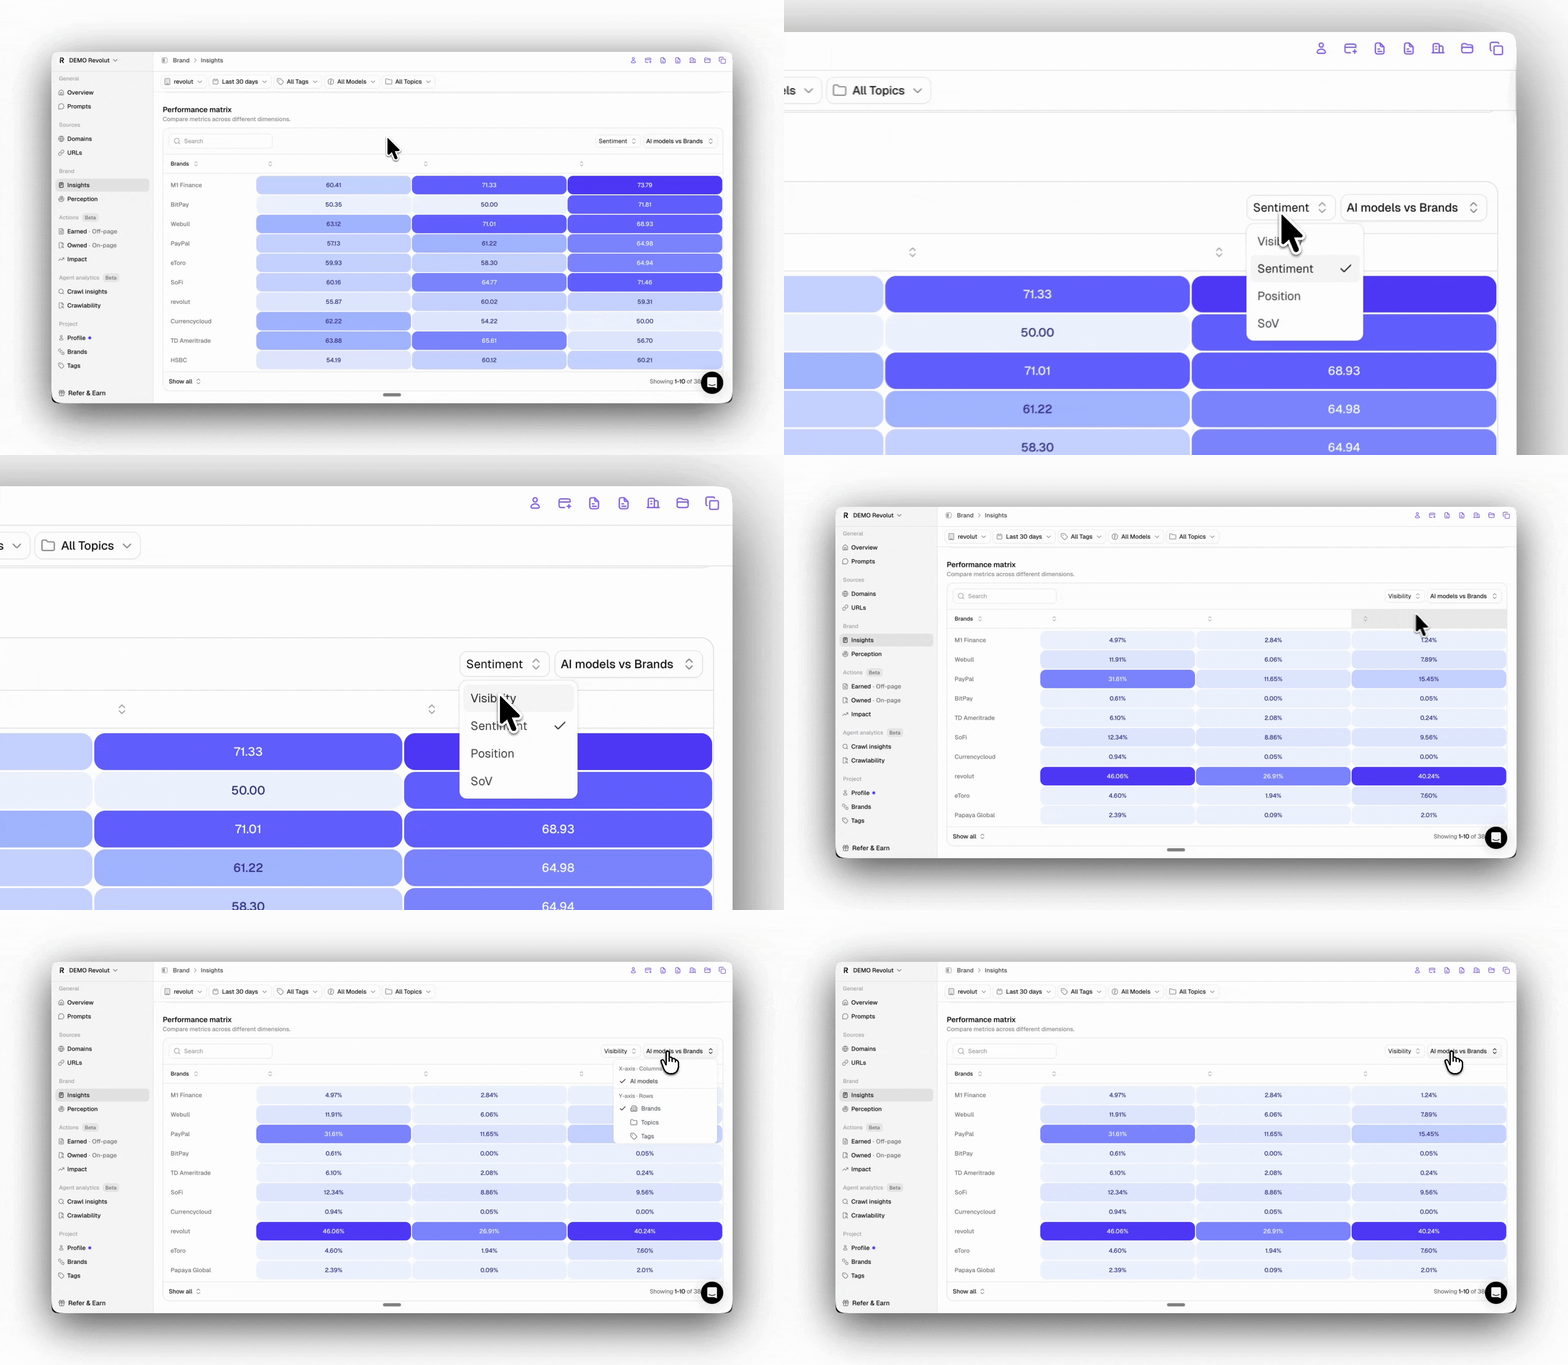
Performance matrix
A configurable matrix that crosses any two dimensions against each other. You control both axes, choosing from:- Models (ChatGPT, Claude, Perplexity, etc.)
- Brands (competitors)
- Topics
- Tags
- Countries
- Which topics does the brand own on ChatGPT but not Perplexity?
- Where is a competitor outperforming my brand, and in which specific markets?
Use the actions menu on any section to save or copy the view as an image, or export it as CSV.
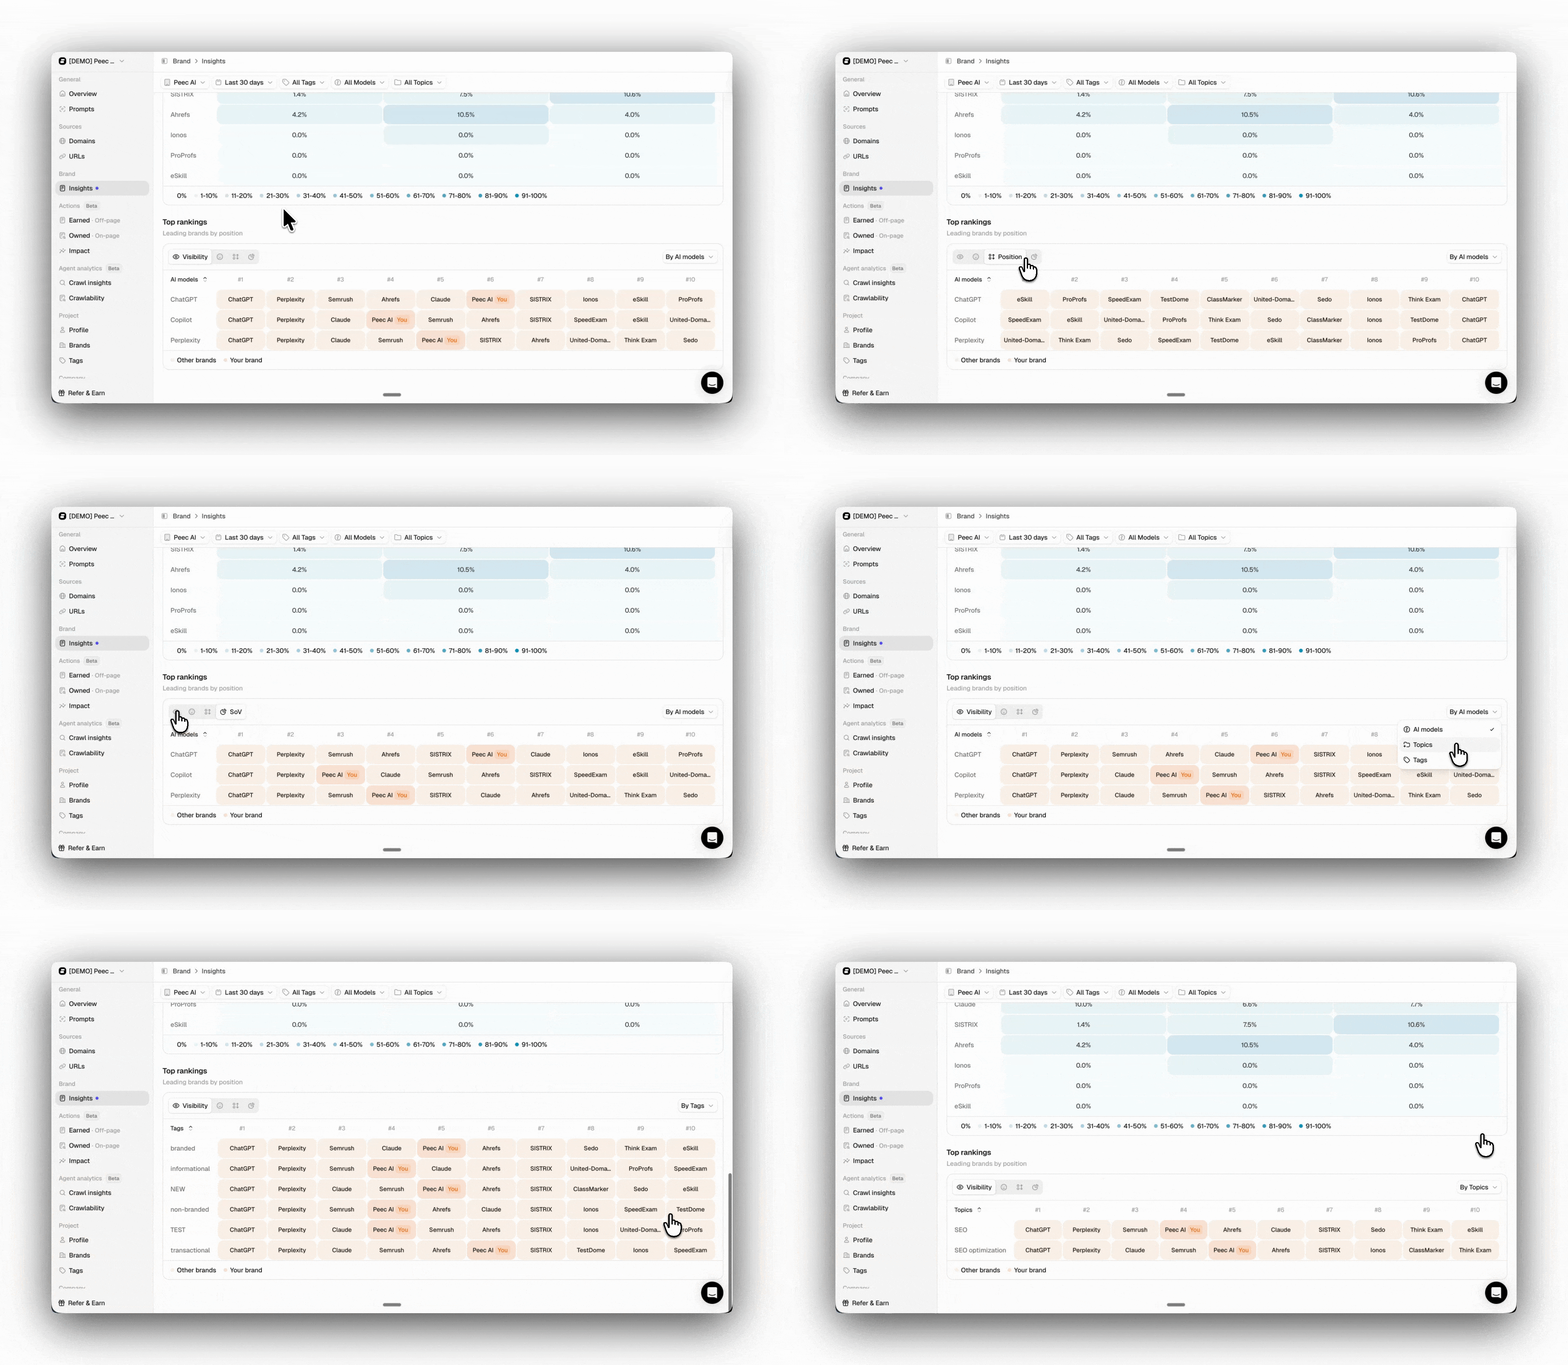
Top rankings
Shows how brands rank against each other for a dimension you choose (by AI model, topic, tag, or country). Each column is a rank position, from#1 through the top brands, and each cell holds the brand sitting at that rank, with your own brand highlighted. Use the metric control to choose whether ranks are ordered by Visibility, Share of Voice, Sentiment, or Position.